Note
The Geofencing dashboard can also be found in the Dashboards section of the Merchant Home page.

In this release you’ll find the new Campaign Center under the “Marketing Tool” header. This is the first major feature set resulting from our focus on delivering a fantastic user experience. You will notice major changes to the look and feel of the page, as well as new, seamlessly integrated data and graphs. It will give you an excellent understanding of your campaign activity (and success) in 5-minutes or less. In the chart below, please find a quick overview of what’s new.
Keep in mind that the Campaign Center consolidates the former “Campaign Statistics” and “Campaign Tool” navigation links into one easy place. The following information details the information you can find on each page.

1. Overview Page
On the Campaign Center overview page, you will find the following three sections when you arrive at the Campaign Center:
Each of the sections mentioned above can be minimized or maximized as needed. To do so, click on the arrow to the left of a section. This will be a constant theme throughout the Campaign Center, so you can continue to focus on what’s most important to you and hide any distractions. You can also jump right to the Campaign Tool flow from this page, by selecting the “New Campaign” button in the top right corner if you wish to create a new campaign from scratch.
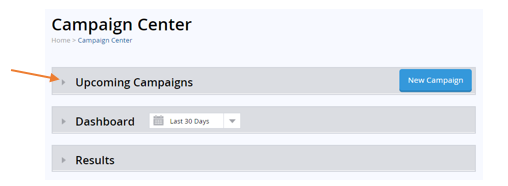
1A. Upcoming Campaigns
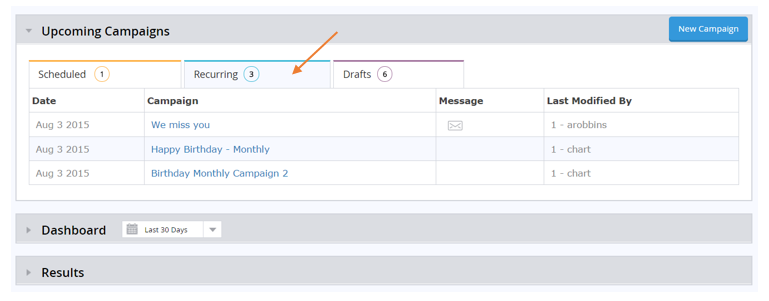
In the Upcoming Campaigns section, you will notice there are three tabs included in this window. The default view will show the Scheduled campaign occurrences that are set up to execute sometime in the future. Once the campaign has gone out, the occurrence will appear lower on the page in the Results section.
The second tab shown to the right of Scheduled, is Recurring. Some examples of recurring campaigns that could be running are birthday, we miss you, anniversary, etc. The number of recurring campaigns will vary depending on your program and set up. Speak with your Technology Consultant if you have questions about existing campaigns or wish to include additional recurring campaigns.
The third and final tab displays the Draft campaigns. These are campaigns that have been created, but have not yet been assigned an execution date in the future. If you wish to edit an existing draft, select the Draft tab, and click on the hyperlink to the appropriate campaign name you wish to edit. On this detailed page, you will see an “Edit” button in the top right corner. This button will bring you to the campaign tool to make any desired changes.
A small number appears next to each tab, which represents the number of Scheduled, Recurring, and Draft campaigns you at the moment.
1B. Dashboards
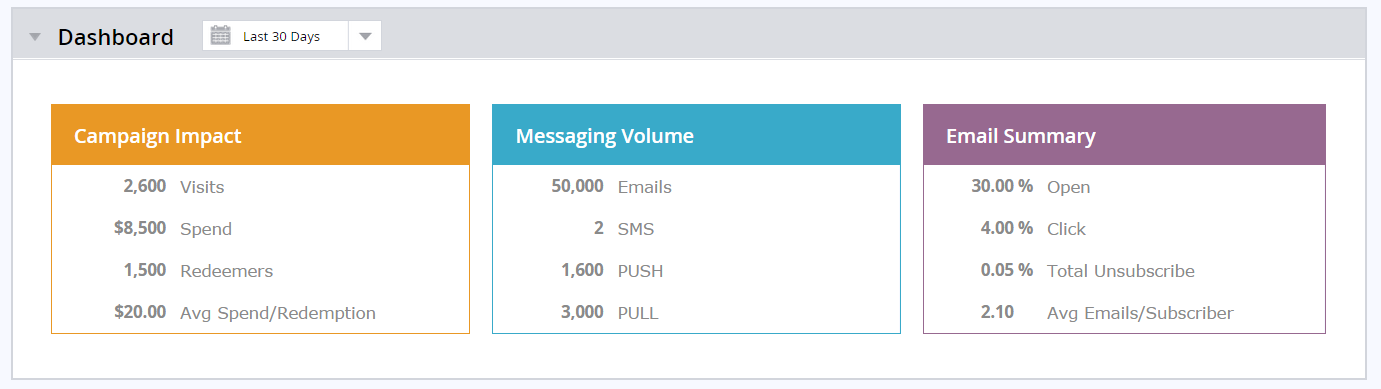
The Dashboard section of the Campaign Center overview page includes three buckets of information, all of which are summarized based on the date range selected. The dropdown next to the Dashboard header defaults to show the last 30 days of campaign activity. You can change this selector to a higher or lower number of days depending on the number of campaign occurrences you wish to show at one time.
Let’s take a closer look at the three buckets of data shown above, starting with the Campaign Impact. In general, the information found in the orange box represents the amount of overall spend, visit, and redemption impact your campaigns are having. When you initially create a campaign, you should define the number of days it will impact sales. For example, a Mother’s Day promotion that is only active through the weekend should impact sales for 2 days only, whereas a birthday campaign that has a reward attached should expire when the reward expires, perhaps 15 or 30 days later.
Also note, you can change the Campaign Impact even after the campaign has executed. This will simply change the days of statistics that are included in your overall campaign impact dashboard. This impact number is important to help reduce any double counting of guest behavior. If you are unsure what your impact should be, please speak with your Technology Consultant.
The Messaging Volume table includes all messages that are being sent out via scheduled campaigns. This will include all Email, Push, Pull, and SMS messages that were sent for campaigns executed over the designated period of time. For example, “Last 30 Days” is the default time period selected. This messaging volume does not include any Real-Time messages. Please contact your Technology Consultant for more information on Real-Time message statistics.
The Email Summary dashboard provides aggregate statistics – from average open rate to emails sent per subscriber – for all emails that were sent by campaigns executed over the designated period of time.
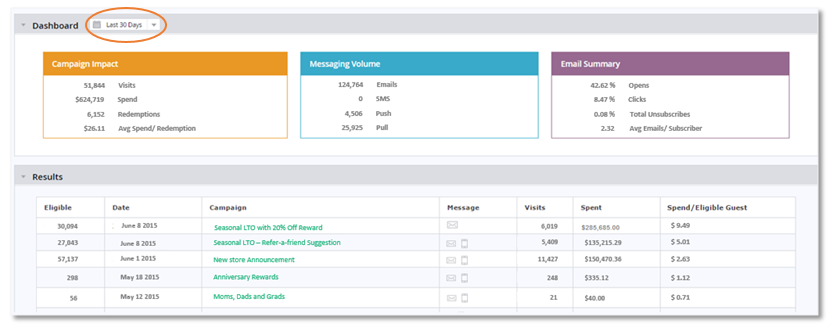
1C. Results
The Results section is closely tied to the Dashboards section, because the date range selector applies to both. For example, if we are choosing to look at the Dashboards over the last 30 days of activity, we are choosing to see the last 30 days of campaign occurrences listed out in the Results section. In this case, there are five occurrences that have been executed over the past 30 days, so the Dashboards will simply display a summary of these five.
Each campaign occurrence will display the number of guests eligible for the campaign offer, the date the occurrence was executed, the campaign name, any associated messages, total number of visits and spend, and lastly the spend per eligible guest. As mentioned in the “Upcoming Campaigns” section, Message will display an icon when there is a corresponding message attached to the campaign. This will be represented as either an envelope to signify an email, or a mobile phone to signify a push, pull, or SMS message.
Each occurrence has a hyperlink on the campaign name, allowing you to dive into the Details section of a particular campaign.
2. Detail Page
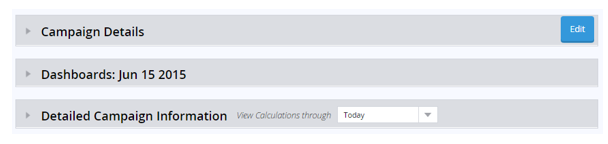
The Campaign Center Details page can be accessed by clicking on a specific campaign. Similar to the Overview Page, there are again three collapsible sections that appear when you dive into a specific Campaign Details Page:
In addition to the three key sections, there is an “Edit” button in the top right corner that will allow you to jump into the campaign tool flow and make any changes to the particular campaign settings, such as changing the expiration date or the execution date.
2A. Campaign Details
The top Campaign Details section will provide the necessary information for each campaign. This is where you can find out the who, what, and when for your campaigns.

2B. Dashboards: Occurrence Date
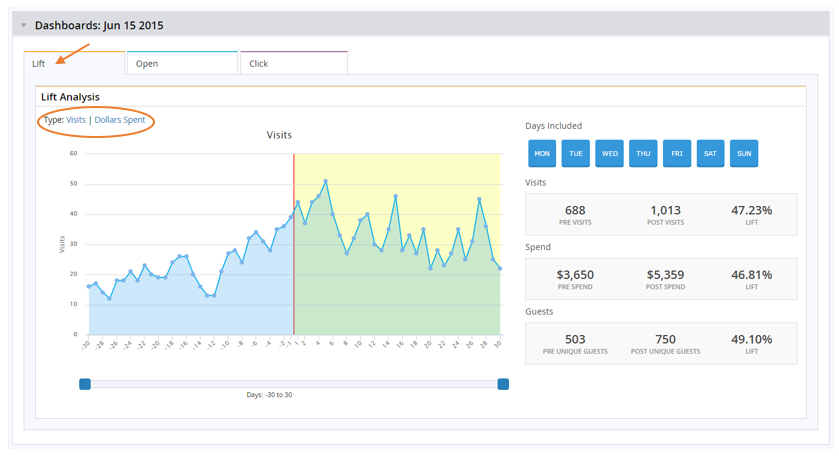
The Dashboards section on the details page will display graphs for the selected occurrence. You can tell which occurrence is being graphed by the date listed next the “Dashboards” name. There are three different graphs available per occurrence and they can be accessed using the tabs at the top. This section will default to display the “Lift” graph.
There are two lift graphs available to view the guest behavior pre- and post-campaign execution. The default lift graph plots the Visits both pre and post. In the top left corner, there is an option to switch the view to plot the Spend, pre and post. The red line in the center of the Lift graphs marks the start of the campaign occurrence. The x-axis represents the 30 days before the occurrence went out, along with the 30 days after execution. You can mouse-over any of the data points to get the number of visits and spend for a particular day. If you wish to increase or decrease the number of days being graphed, use the blue sliders along the x-axis to change the number of days.
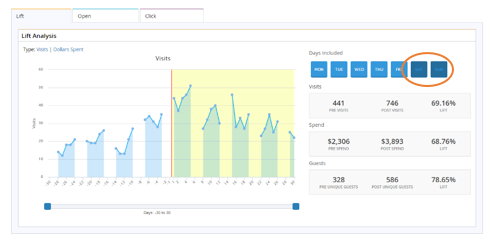
If you wish to exclude a certain day of the week, you can do so by selecting that day on the right. The pre- and post-calculations on the right will adjust accordingly and the days will also be eliminated from the graph view. For example, we could choose to exclude Saturdays and Sundays. This is helpful if you happened to be closed on a certain day of the week or ran another promotion on some date and need to eliminate results from interfering with the Lift calculations.
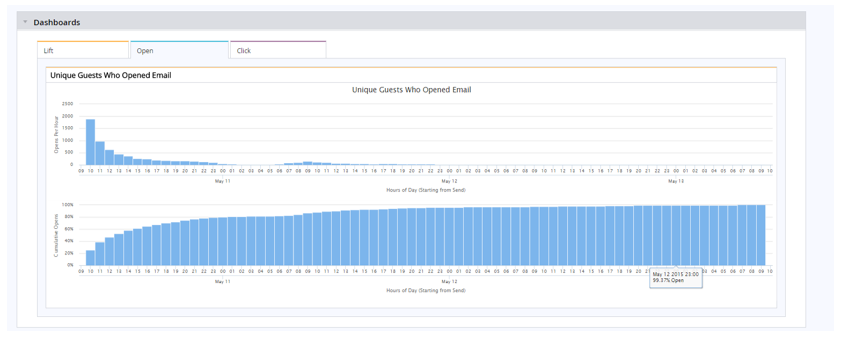
The next tab available on the Dashboards page will show the “Open” graphs. The top graph represents the number of emails opened by hour. The bottom graph plots the same information, but with a cumulative lens. For example, you might notice there were around 1,000 opens in the first hour that the email was sent out by hovering over that data point. Then if you go down to the cumulative graph and hover over that same hour and data point, the graph may show that over 30% of the total opens came in that first hour.
Similarly, if you click on the third tab, “Click” you will see two similar graphs. This time the graphs are plotting the email clicks by hour. Both the Open and Click graphs will show data for the first 72 hours after an email campaign has been sent. These measures can assist with answering the question, “When is the best time to send my emails?”
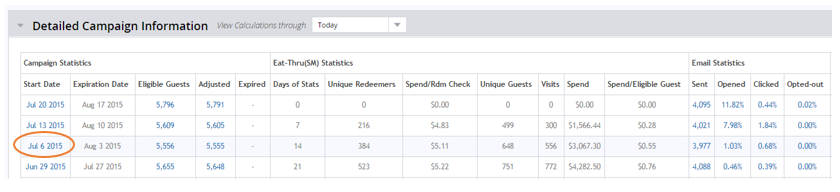
2C. Detailed Campaign Information
The third section on the Campaign Details Page displays the Detailed Campaign Information by occurrence. For recurring campaigns, each occurrence will show up in order of execution date with most recent occurrences at the top. The occurrence that is highlighted in blue in this section, will match the occurrence that is currently being graphed in the Dashboards section. In order to change the graphs to a different occurrence, simply click on the date hyperlink that corresponds to the occurrence you wish to see.
The detailed statistics shown are broken out into three sections, (1) Campaign, (2) Eat-Thru, and (3) Email. Your Campaign statistics include start date, expiration date, eligible, adjusted, and expired. Eat-ThruSM statistics include the number of days of stats being displayed at one time, the number of unique redeemers (defined as those who redeem the offer included in your campaign), the spend/redemption check, the unique guests, the total visits, and total spend. Lastly, the email stats will include the number of emails sent, along with your open, click, and opt-out rates.
The Campaign Report
If you need to view a campaign that was executed over one year ago, you can still access that data in the Campaign Report.
Further, as of V15.12, several new columns are now available in the Campaign Report – including spend per eligible guest, unique redeemers, dollars spent per redemption check, and more. To access this report, click on “Run Reports” under the Report Center and select the Campaign Report summary.
The Campaign Tool
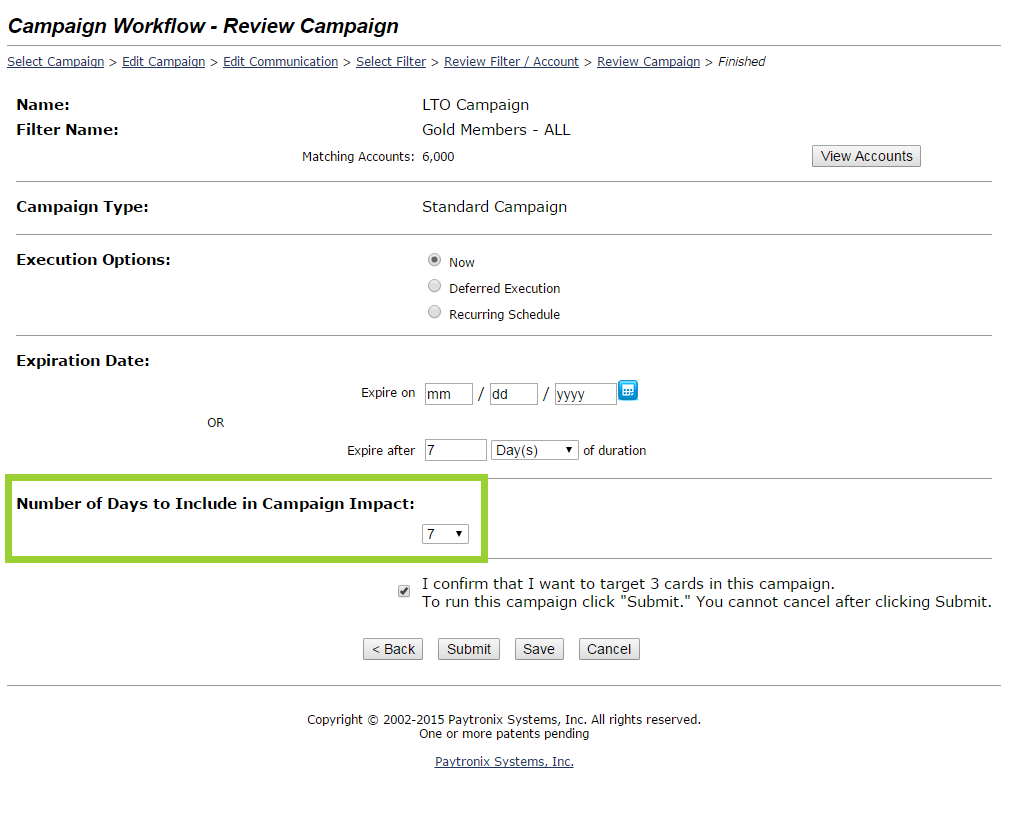
As mentioned above, there is a new section in the “Campaign Workflow – Review Campaign” page called “Campaign Impact.” This helps you gauge the number of days your campaign made an impact on your business.
The number selected in the campaign impact field will default to match the number of days between campaign execution and your selected expiration date. If this number is greater than 30 days, the system will select 30 days. If you change the expiration date in the campaign tool, your impact will change automatically. Inside the Campaign Center, you can manually change the impact as well if needed.
For emails sent via the Email Tool only and not executed via the Campaign Tool, campaign impact will default to 3 days.
New Attached Statuses in the Email Tool
For all messages that are attached to a guest or admin messaging rule, you will now see a new status in the email tool called “Attached – Rule” or “Attached – Admin.” These statuses indicate that the email could be sent out in real time if the rule runs. The system will prevent marketers from editing an email that is in the “Attached” state.
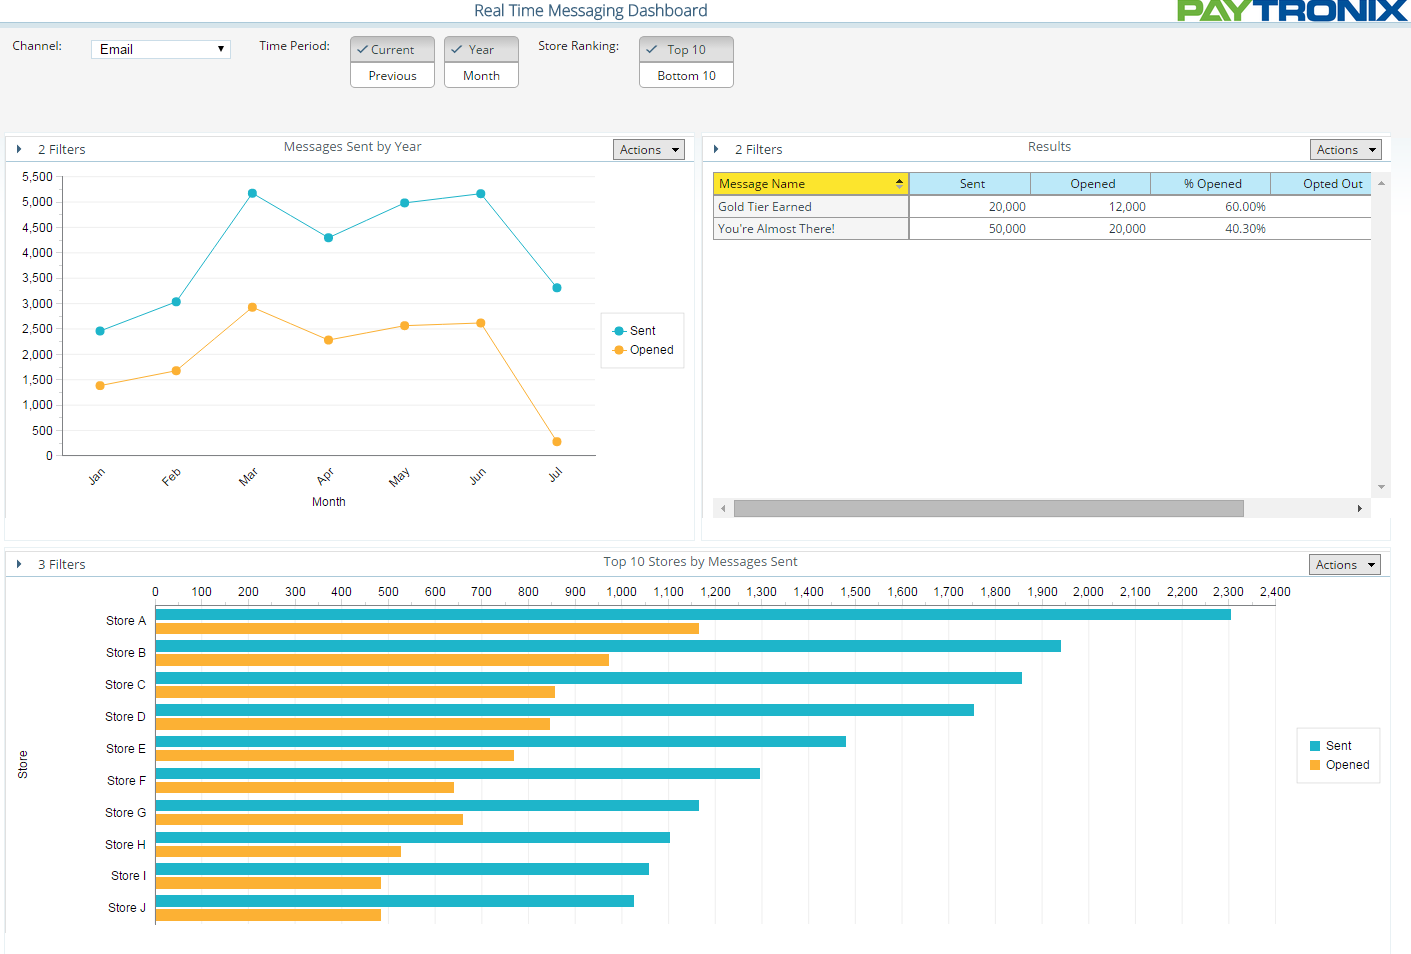
Real-Time Messaging Dashboard
Clients that send multi-channel messages to guests based on POS activity in real-time can now view and analyze exciting new metrics on these messages, including:
Simply click on the “Dashboards” link under the “Report Center” header, and click on the Real-Time Messaging Dashboard. Then, select the channel on which you would like to report. There are three dashboard views available: Email, Push/Pull/SMS, and Geofencing.
Clients are having great success with Paytronix’s location-based geofencing messages. These messages compel members to visit and spend on the same day that they receive the message at an astounding rate. Thanks to the latest release, clients can now visually interpret their geofencing campaign data inside the Geofencing Center.
Reporting Tab
To view the geofencing dashboard, simply click on the “Reporting” tab inside the Geofencing Center. If the tab is not visible, please contact your technology consultant to receive the proper permissions.
Inside the dashboard, clients can answer the following questions:
In the dashboard, clients will see each campaign broken down by the number of messages sent, number of visits, and the total number of dollars spent. The visit and spend must occur in the same day in order to count toward the message’s visit and spend statistics.

The Geofencing dashboard can also be found in the Dashboards section of the Merchant Home page.
In V15.12, the following improvements were made to the responsive guest website:
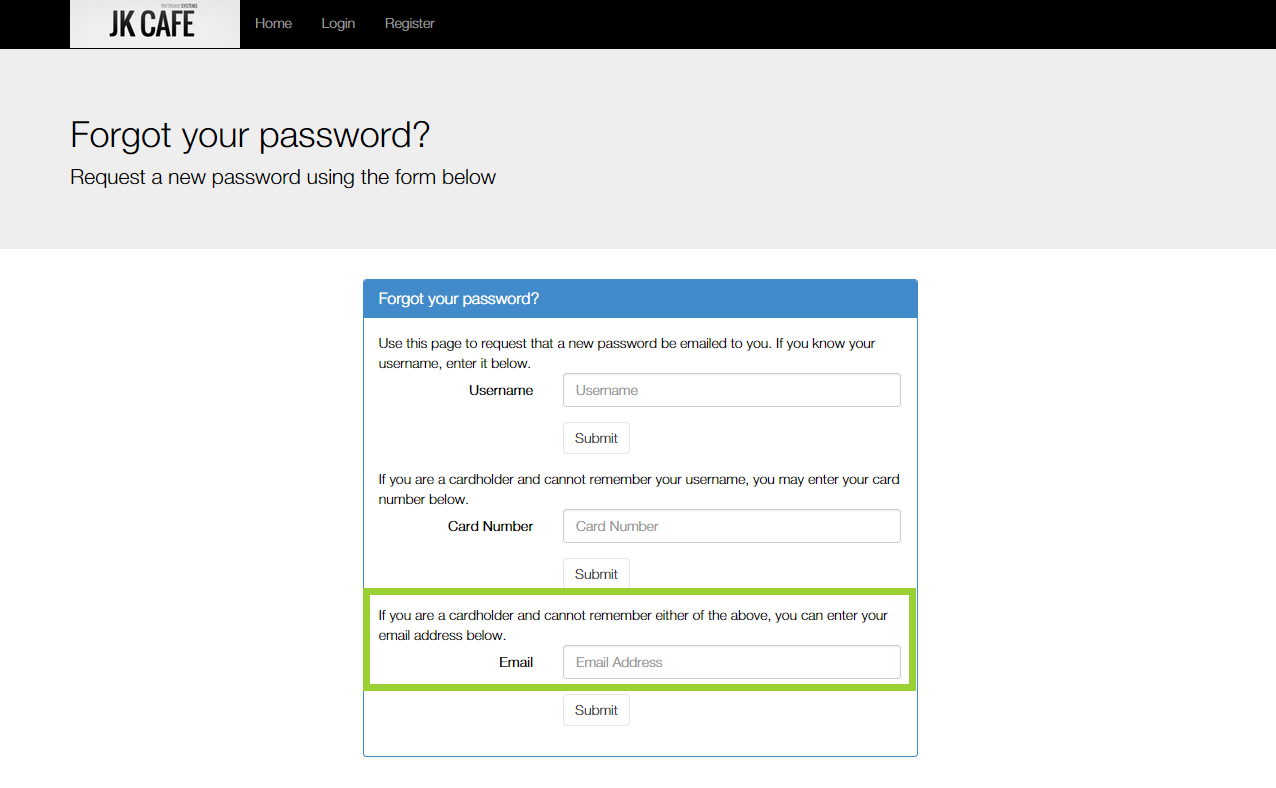
Reset Password Flow Improvements
The standard reset password functionality has changed. As of the latest release, guests can trigger the reset password email by entering in the email address, card number, or username associated with the account. If a guest attaches a single email address to multiple accounts, he or she must enter a different unique identifier (i.e., card number or username) to trigger the reset password email instead.
An email will automatically deploy to the guest, which includes a unique URL. To reset his or her password, the guest simply clicks on the URL, which opens a browser, and enters in a new password of their choice.
To ensure that the reset password flow for your program is updated, reach out to your technology consultant. Keep in mind that this improved functionality will not be available on our legacy customer webpages. You must upgrade to the responsive customer pages to take advantage of this feature. Also, your technology consultant must update the substitution parameter in your reset password email. It should become:
<template:link type="reset_password_url">Click Here to Reset Your Password</template:link>
Set Your Merchant Home Screen
You can now select your favorite, most-referenced page – from Account Lookup to the new Campaign Center – as the home page that appears with each subsequent login. Simply click the star icon at the top of the page, choose “Yes,” and you’re done! Keep in mind that you can change your home page at any time in the future.
Google Wallet API Update
In order to ensure compliance with Google Wallet’s API updates, Paytronix has updated its integration to the service.
1. Third-Party Library Software